Graphify for Developers: Build a Codebase Knowledge Graph and Measure Its Value
You ask a coding assistant: “If we change how product prices are calculated, what other parts of the application could break?” On a tiny project, a few source files may be enough. On a large codebase, finding all the relationships between functions, modules and dependencies can require a lot of reading and repeated searches.
The real difficulty is not merely the number of files. A function in products.py may be called from orders.py, then feed a checkout step or API response. To understand the consequences of a change, an assistant needs a map of relationships, not a pile of disconnected excerpts.
Graphify is one tool you can evaluate for that job. It turns a repository into a queryable knowledge graph so a supported coding assistant can navigate connections among code elements. This article is for developers and AI implementation teams—not a required step for everyone using conversational AI.
Graphify in plain language
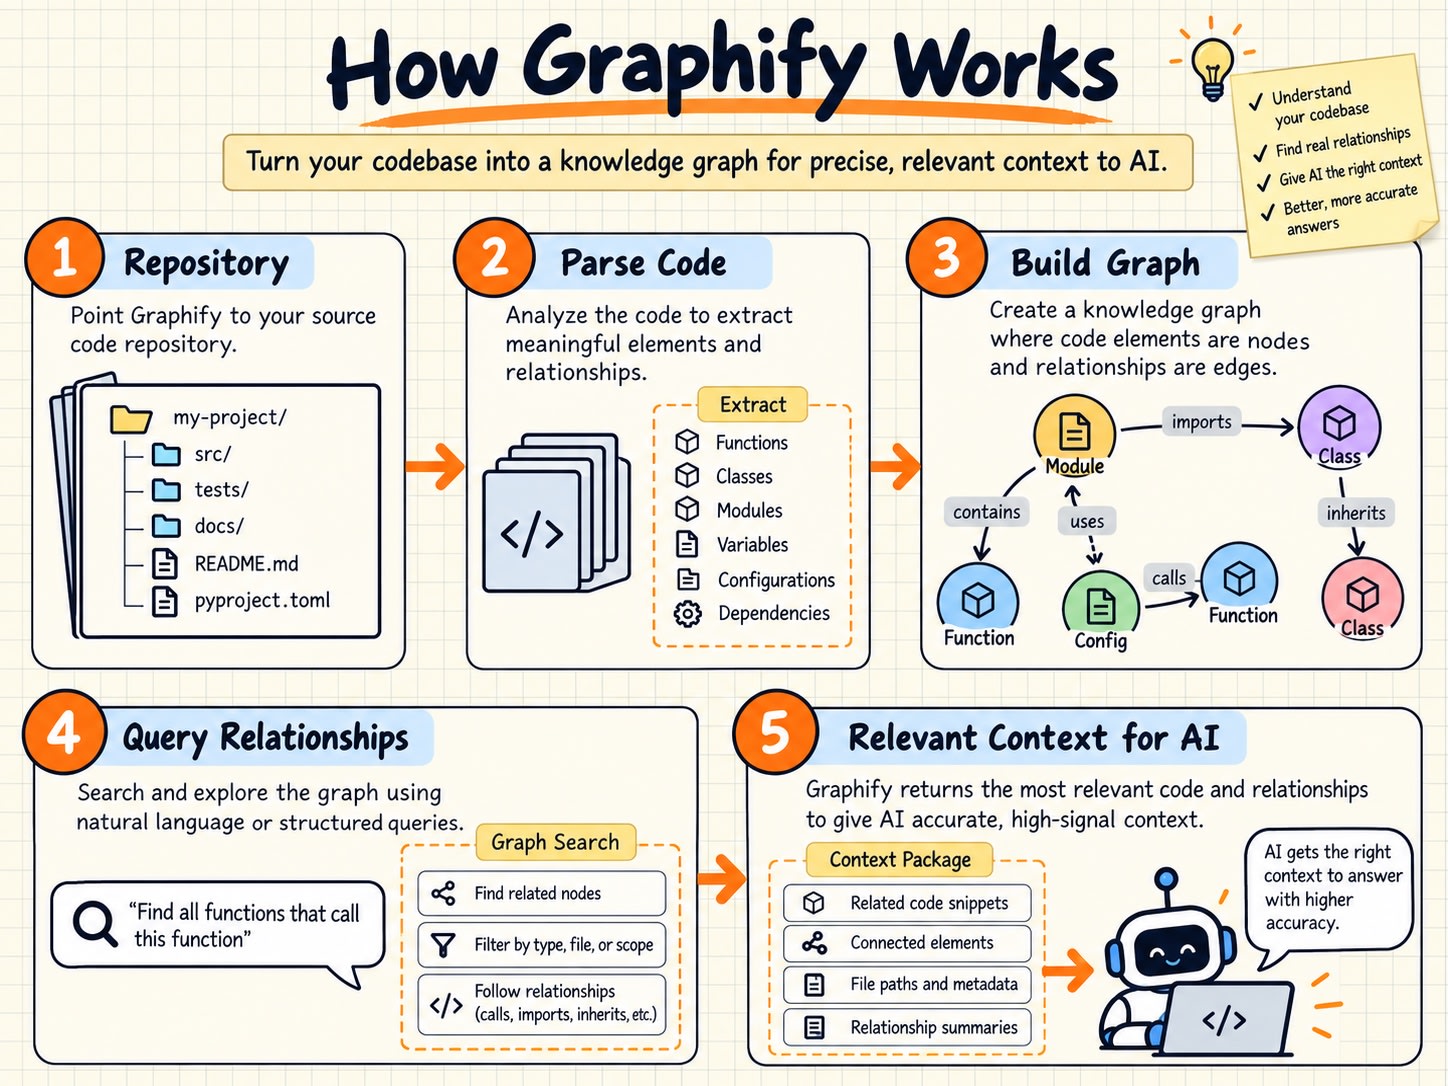
Picture your codebase as a city: files are neighborhoods, classes and functions are places, and imports or calls are roads between them. A knowledge graph stores the places as nodes and the relationships as edges. Instead of repeatedly guessing the route, the assistant can inspect a graph of possible paths.
A codebase is the project's source and related artifacts. A node may represent a function, class or file. An edge represents a detected relationship. A graph is not proof that code is correct; examine the source when a connection matters. According to the official README, source code is parsed locally with tree-sitter: no LLM is involved and the code never leaves your machine. Documents, PDFs, images and video go to your assistant's model, or an API key you configure, for a semantic pass, so review your settings before including internal documents.
When does Graphify make sense?
Consider it when you repeatedly investigate large repositories, trace a call across modules, locate all usages of a function or review the impact of a change. It may be unnecessary for a small one-file script, ordinary business prompts or work where graph creation costs more than the expected queries save.
A safe example: sample-shop
Imagine a tiny project with two files. products.py defines get_price(product_id). orders.py defines checkout(product_id, qty=1), which calls get_price:
# products.py
PRICES = {"A001": 22.0}
def get_price(product_id):
    return PRICES[product_id]

# orders.py
from products import get_price
def checkout(product_id, qty=1):
    return get_price(product_id) * qty
The learning goal is to find the relationship from checkout to get_price and verify it against the original code. Node names and the exact visual rendering will vary. Never use client records, API keys or private contracts in a tutorial repository.
Step 1 — Set up your environment
Use Python 3.10 or newer and a supported coding assistant. Check python --version or python3 --version. Install uv using the operating-system instructions at https://docs.astral.sh/uv/ and confirm uv --version. Windows users may use winget install astral-sh.uv where supported.
Step 2 — Install Graphify
Run the following in your terminal:
uv tool install graphifyy
graphify --version
graphify install
The official PyPI package is graphifyy, with two y's; the executable is graphify. graphify install detects the assistant you use and registers the skill. Supported assistants include Claude Code, Cursor, Codex, Gemini CLI and more than 20 others. If you prefer pipx, install with pipx install graphifyy. Check the project's documentation for optional --project and --platform flags. If graphify is not recognized, verify your PATH; uv tool update-shell may be appropriate.
Step 3 — Build the codebase graph
Open sample-shop in your supported AI coding assistant and enter in the assistant chat:
/graphify .The period points to the current project directory. This is a supported assistant skill instruction, not a terminal command. The current Quickstart describes selecting the $graphify skill in Codex and asking it to map the repository. Follow the instructions for the assistant you actually use.
Step 4 — Inspect the outputs
After processing, inspect graphify-out/. The current Quickstart lists graph.html (interactive graph), GRAPH_REPORT.md (an architectural report) and graph.json (graph data for CLI/MCP operations). Open graph.html and select nodes to inspect their connections. Verify relevant relationships using the source; a visible edge does not validate runtime behavior.
Step 5 — Query the graph
From a terminal at the repository root, try the documented CLI pattern:
graphify query "Where is get_price used?"
graphify explain "get_price"
graphify path "checkout" "get_price"
Use the exact names that appear in your own graph. CLI commands and the /graphify assistant instruction are not interchangeable. The path command shows how two nodes connect and returns a result only if those nodes and edges exist in your graph.
Step 6 — Change the code, then refresh your view
Change a function call in the sample project, then refresh the graph. The current documentation shows two ways:
graphify update .
/graphify . --update
Run the first in your terminal, for example after git pull. Type the second in your assistant chat; it re-extracts only the files that changed. Then check that the graph reflects the code change. Syntax can differ between versions, so record the output of graphify --version in your test notes.
Can Graphify actually reduce tokens?
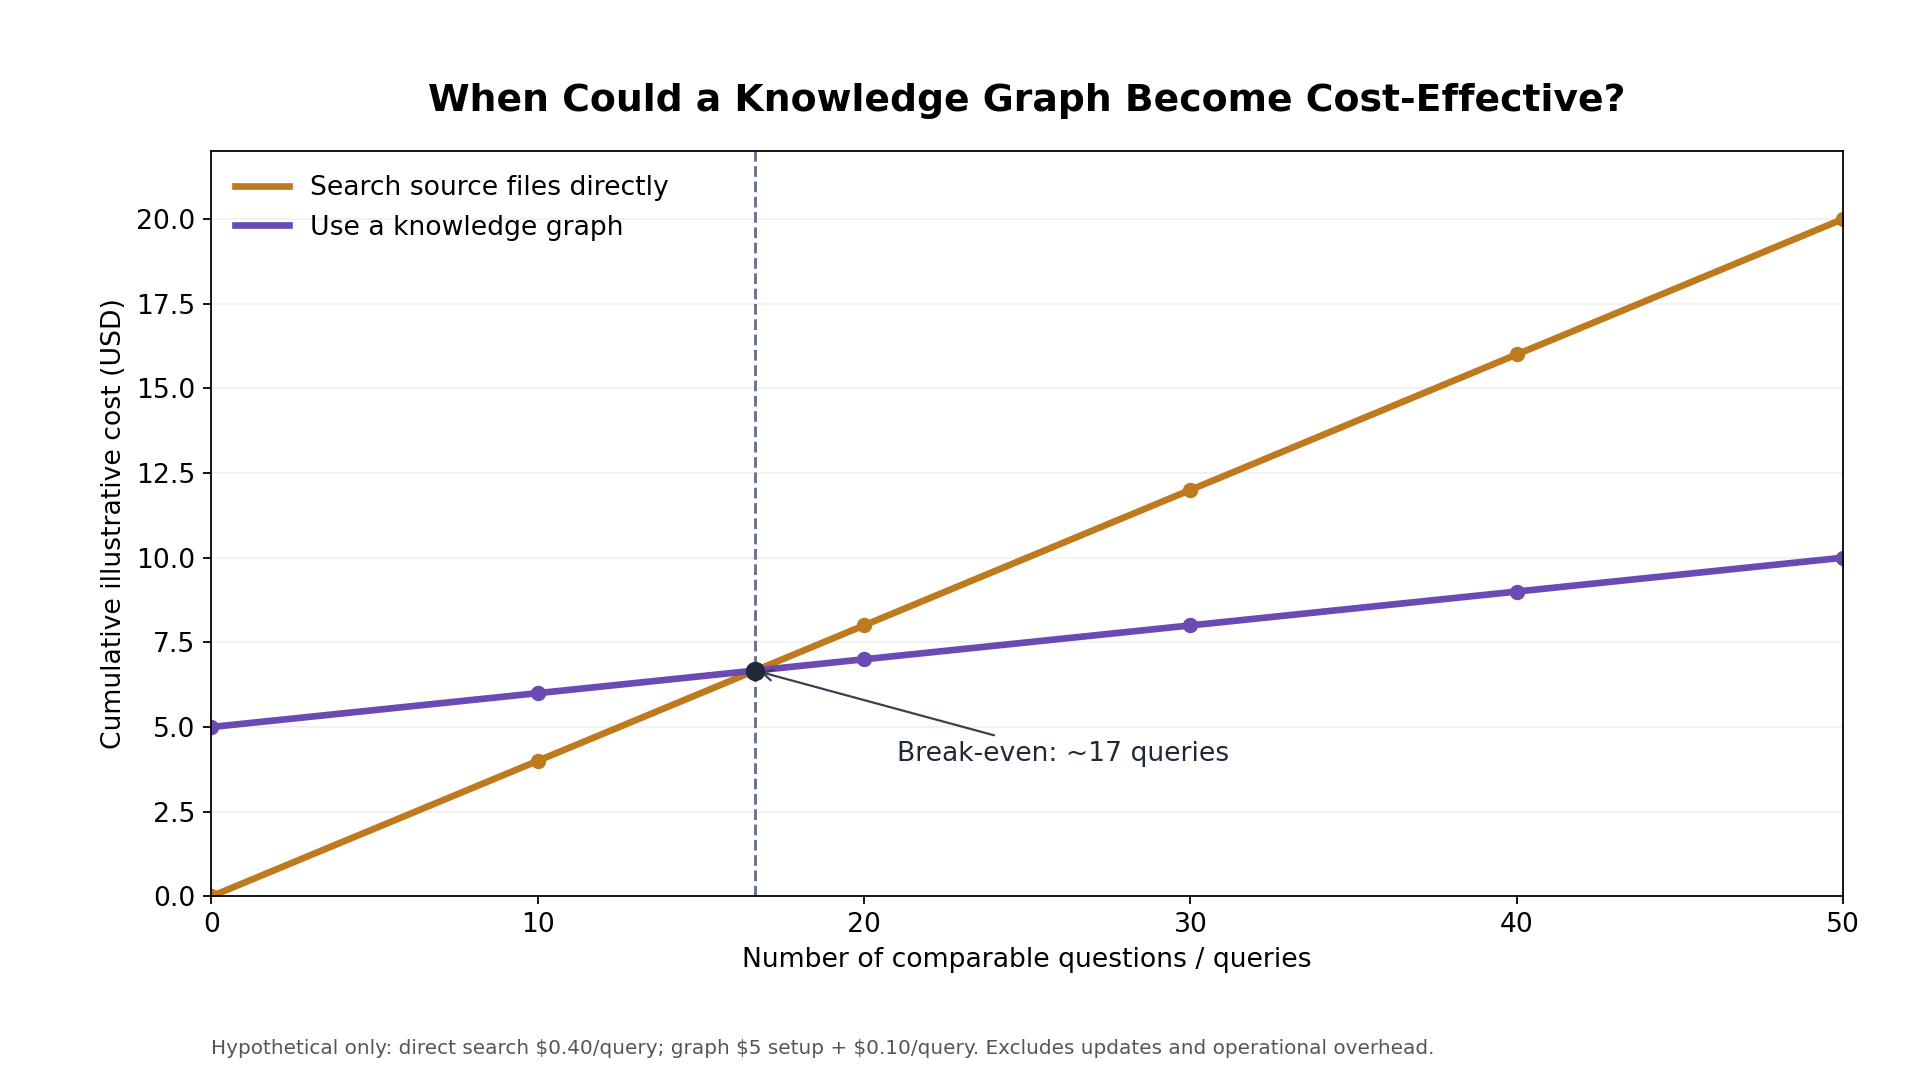
Illustrative chart with hypothetical numbers, not measured results.
Possibly, if retrieving a small graph neighborhood gives the assistant the context it needs without repeatedly reading a large repository. But savings are not guaranteed: initial graph construction, updates, queries, accuracy and repeated questions all matter. The code-parsing step itself uses no LLM; documents, PDFs and images do use a model.
For a fair comparison, ask the same questions using the same model under comparable conditions. Workflow A searches the source files. Workflow B uses the graph. Record accuracy, any provider-reported input/output tokens, time, revisions, graph-building or updating overhead, and total cost across multiple queries. A single question may not justify graph setup.
Record these metrics for both Workflow A and Workflow B:
Metric | How to record |
|---|---|
Accuracy | Correct answers out of total questions asked |
Input/output tokens | From your provider's usage report, if available |
Time | From asking the question to getting a usable answer |
Revisions | Number of follow-ups or corrections needed |
Graph build/update cost (B only) | Tokens and time for the first build and each update |
Total cost | Summed across many questions, not just one |
Note: The official documentation does not publish a fixed token-saving figure for the open-source Graphify CLI. The “80% fewer tokens” claim on the project page refers to Graphify Cloud, a paid product. Only publish numbers you measure on your own project.
Troubleshooting and practical limits
“graphify: command not found”: inspect the uv installation and your PATH, then reopen the terminal.
Skill not detected: confirm the assistant integration and rerun the documented install for that platform.
Missing nodes: confirm the target folder, supported files and the actual names in graph output.
Unexpected answers: cross-check the source. A graph edge is evidence of a detected relation, not proof of code correctness.
Closing: use a graph when relationships matter
Graphify is most compelling when your team frequently asks what depends on a function, module or change. Start with one safe repository, verify the mapped relationships and measure results on your actual development tasks. A beautiful graph alone is not a cost-saving benchmark.
Official repository: https://github.com/Graphify-Labs/graphify
Quickstart: https://github.com/Graphify-Labs/docs/blob/main/quickstart.mdx
uv installation: https://docs.astral.sh/uv/
NiMo beginner guide: 4 ways to reduce AI token waste
NiMo Solutions — Make Your Next Move Count.